Market Sentiment
Primary Assets Affected
Table of Contents
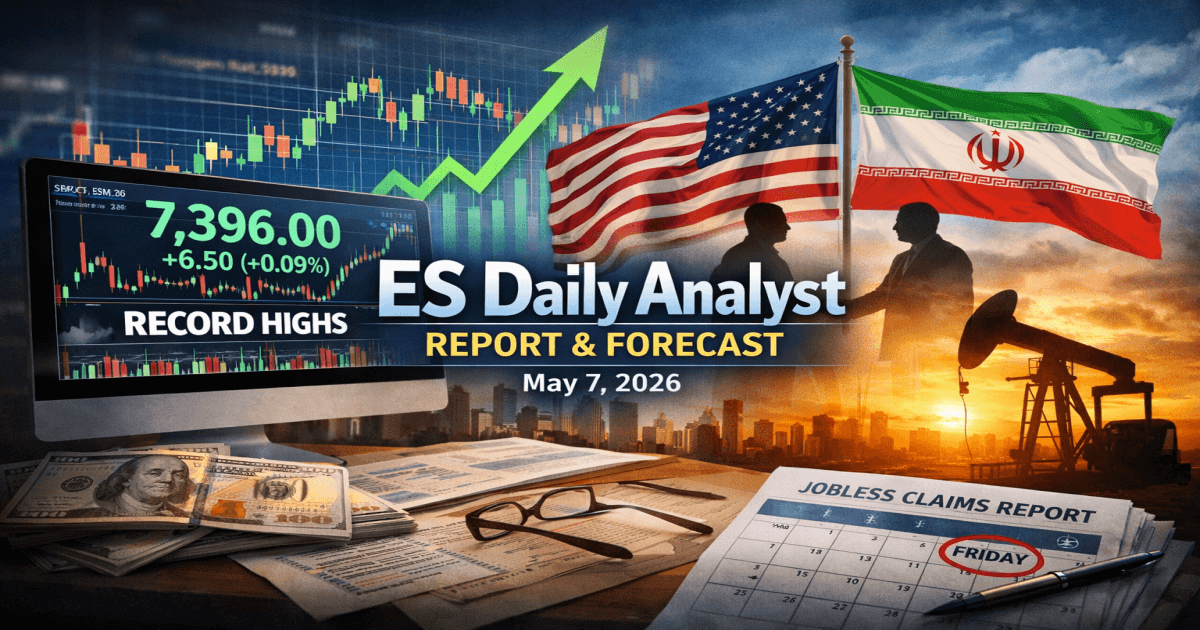
US markets closed last week at all-time highs, carried by a better-than-expected earnings season and a jobs report that beat forecasts. The S&P 500 gained 2.3%, finishing at 7,398.93. The Nasdaq Composite added 4.5% to close at 26,247 — a sixth consecutive winning week, the longest streak since 2024. The VIX sits at 17, a number that reads as comfort, not euphoria.
The week ahead will not be as quiet.

Tuesday's inflation report is the event of the week. March already delivered an uncomfortable surprise: annual CPI climbed to 3.3%, the highest since May 2024, dragged higher by a 21.2% monthly surge in gasoline — a direct consequence of the Middle East conflict. The question the market is now asking is whether the energy shock stays contained or starts bleeding into core categories. A core reading of 0.4% month-on-month would suggest the answer is beginning to be yes.
S&P 500: six weeks of gains, one level that matters
The short-term trend is clear: bullish. But six consecutive winning weeks compress any marginal edge on new long positions. At 7,399, the index sits just above the 1.618 Fibonacci extension at 7,342, a level already confirmed as support after multiple tests. A hot CPI print Tuesday is the most direct threat to that floor. Hold it and 7,500 is the next logical target. Lose it on volume and 7,200 comes back into play fast.

The S&P 500 has now posted six consecutive all-time highs on weekly closes. That kind of momentum tends to continue until something stops it. This week has several candidates for the job.
Nasdaq: AI is carrying the rally, but Warsh can cut it short
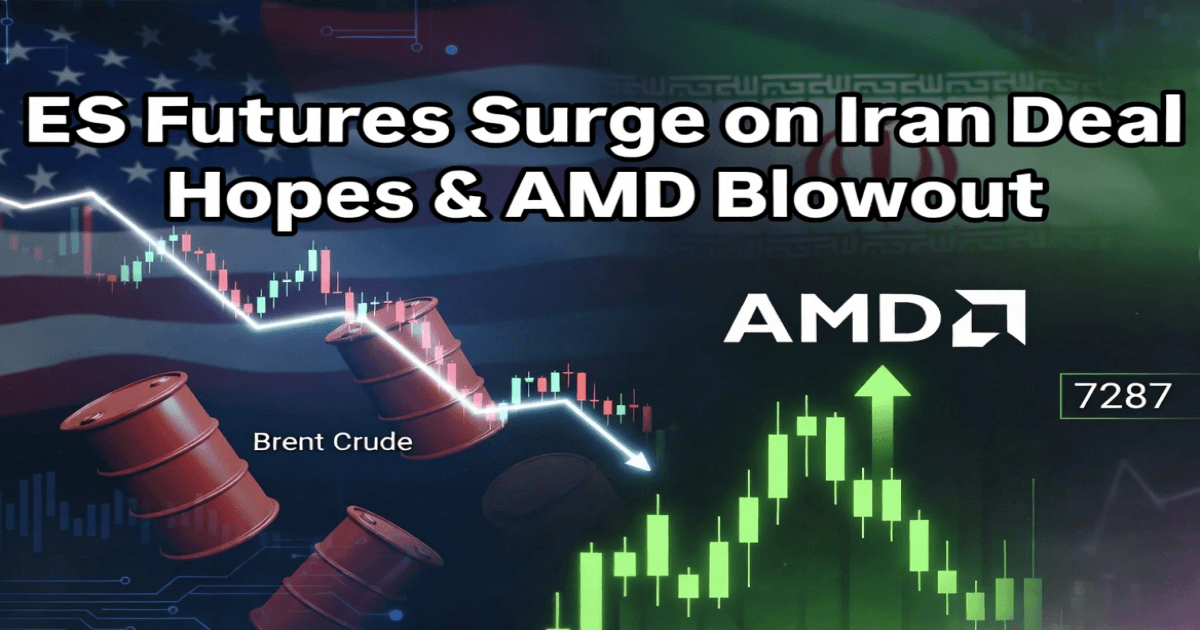
The Nasdaq was the star of last week with a 4.5% gain, driven by solid tech earnings. AMD beat Q1 estimates comfortably. Semiconductor stocks caught additional tailwind from the Rackspace-AMD enterprise AI partnership. The Nasdaq 100 at 29,234 is at an absolute all-time high.
The issue is structural. The Nasdaq is, by construction, the most rate-sensitive of the major indices. Warsh has stated repeatedly that he views the Fed's $6.7 trillion balance sheet as a structural distortion of price signals. If his tone on Thursday when he formally takes over suggests aggressive quantitative tightening, tech valuation multiples compress quickly. 28,500 is the first serious support; below that, 27,800.
Gold: the safe haven that did not behave like one
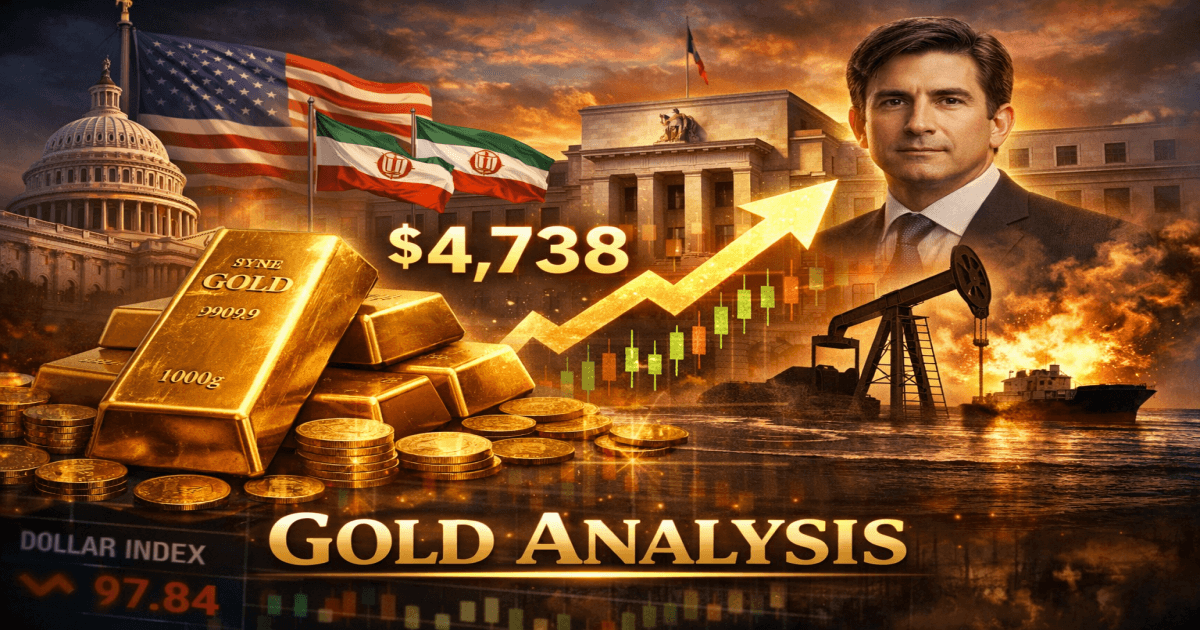
Gold has fallen 14.5% since the Iran conflict began. The S&P 500 lost only 7.8% over the same period. The metal underperformed the very risk assets it was supposed to hedge against. The transmission mechanism is not subtle: expensive oil pushes inflation higher, higher inflation suppresses rate cut expectations, fewer expected cuts push real yields up, and real yields are the primary headwind for non-yielding assets like gold.
The near-term technical picture is more encouraging. Gold broke out of a descending wedge formation on May 7, clearing the trendline that had capped every rally since the March highs. The metal is now in the advancing phase of a new daily cycle, with an estimated cycle high window of May 18–22 in the $4,850–5,050 range.

$4,500 is the structural number of the week for gold. Hold it and the scenario toward $5,000 stays alive. Lose it and the measured-move target at $4,100 comes back on the table. A ceasefire in the Strait of Hormuz would remove the oil-inflation-yield headwind in a single move and could produce a sharp catch-up rally in the metal. That scenario is priced nowhere near adequately at current levels.
The Warsh factor
Jerome Powell leaves after eight years. Kevin Warsh replaces him formally on May 15. The difference in approach is not subtle: Powell tolerated a $6.7 trillion Fed balance sheet; Warsh considers it a policy mistake. He voted against rate cuts during the 2008 financial crisis even as unemployment was rising, which tells you everything about his structural preferences.
The better news is that Warsh has signaled openness to rate cuts driven by AI productivity improvements — exactly the thesis underpinning current tech valuations. Barclays data shows the S&P 500 averages drawdowns of 5%, 12%, and 16% in the one, three, and six months following a new Fed Chair taking over, going back to 1930. That is not a prediction. It is context worth holding alongside a six-week winning streak at all-time highs.
Bias for the week of May 12-16

The base case is a choppy week that resolves slightly higher, assuming CPI comes in roughly in line and the Trump-Xi summit produces no negative surprise. The real risk is the combination of a hot inflation print and hawkish balance-sheet language from Warsh — that pairing could produce a sharp, likely temporary, selloff across equities and gold simultaneously. A ceasefire signal from Beijing on Iran remains the most asymmetric positive catalyst on the board, and it is priced into almost nothing at current levels.
The week has enough moving parts to make overconfidence expensive. Position accordingly.