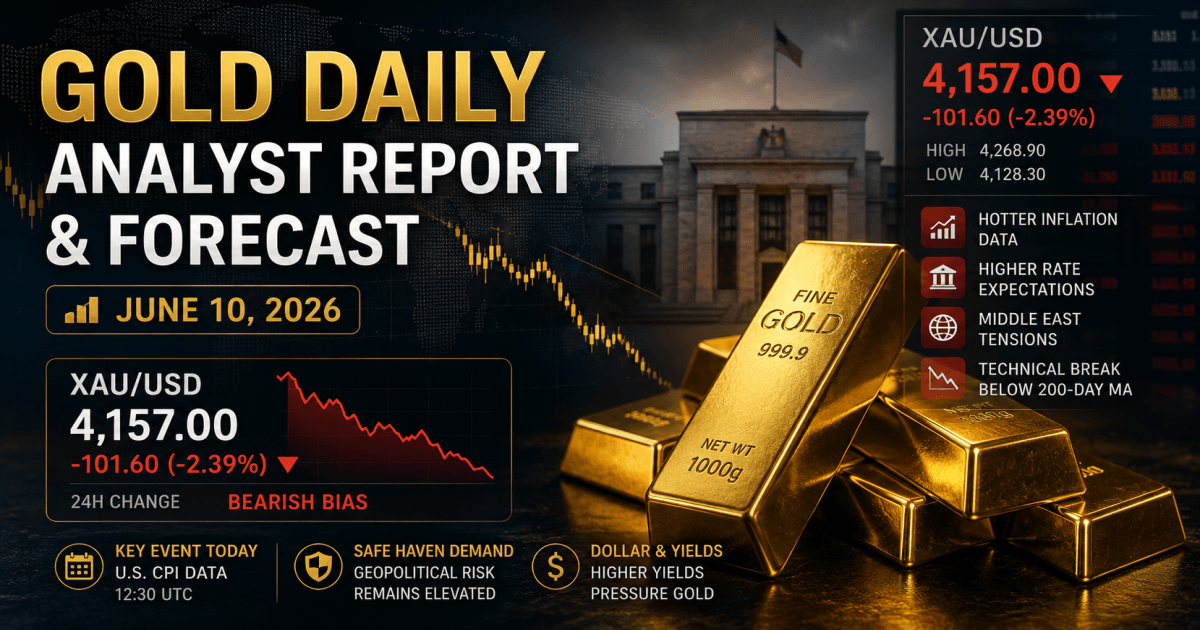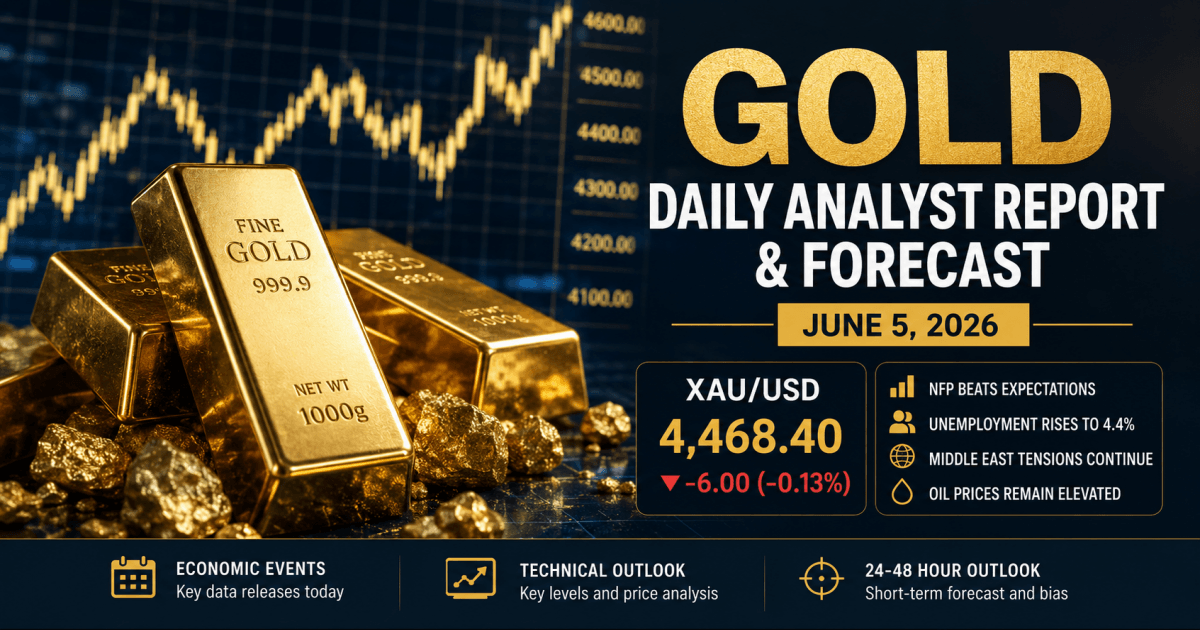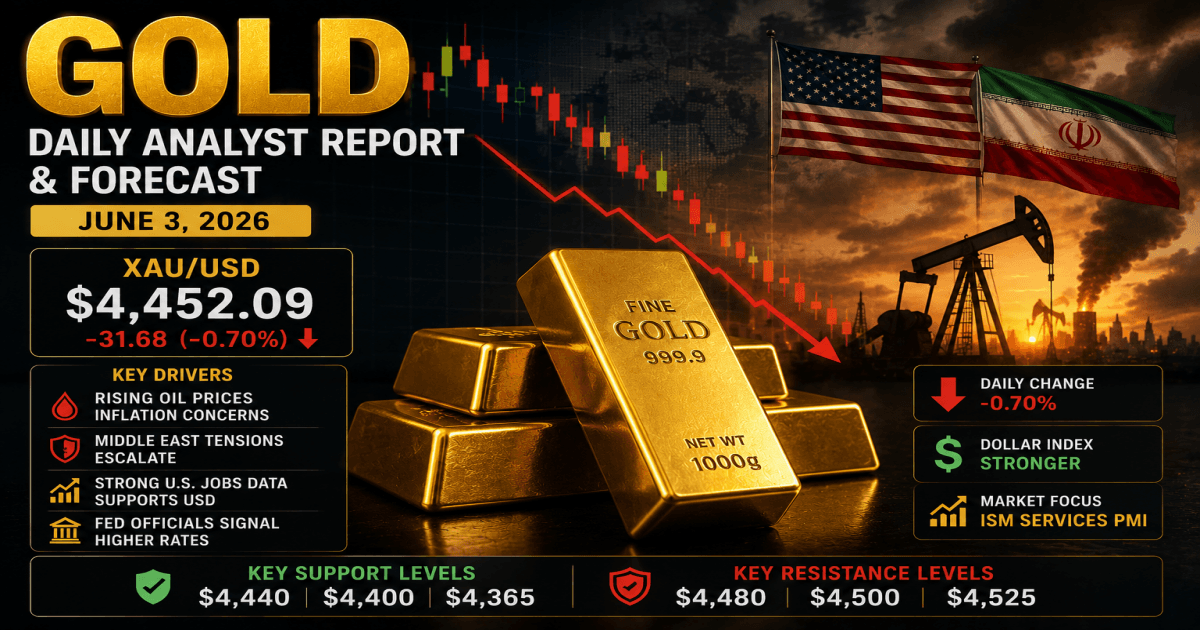
Market Sentiment
Primary Assets Affected
Table of Contents
Most traders focus on finding better entries, better indicators, or the next winning strategy.
The problem is that very few traders spend time analyzing their own performance. Without data, it becomes almost impossible to identify recurring mistakes, understand which setups actually work, or determine where profits are really coming from.
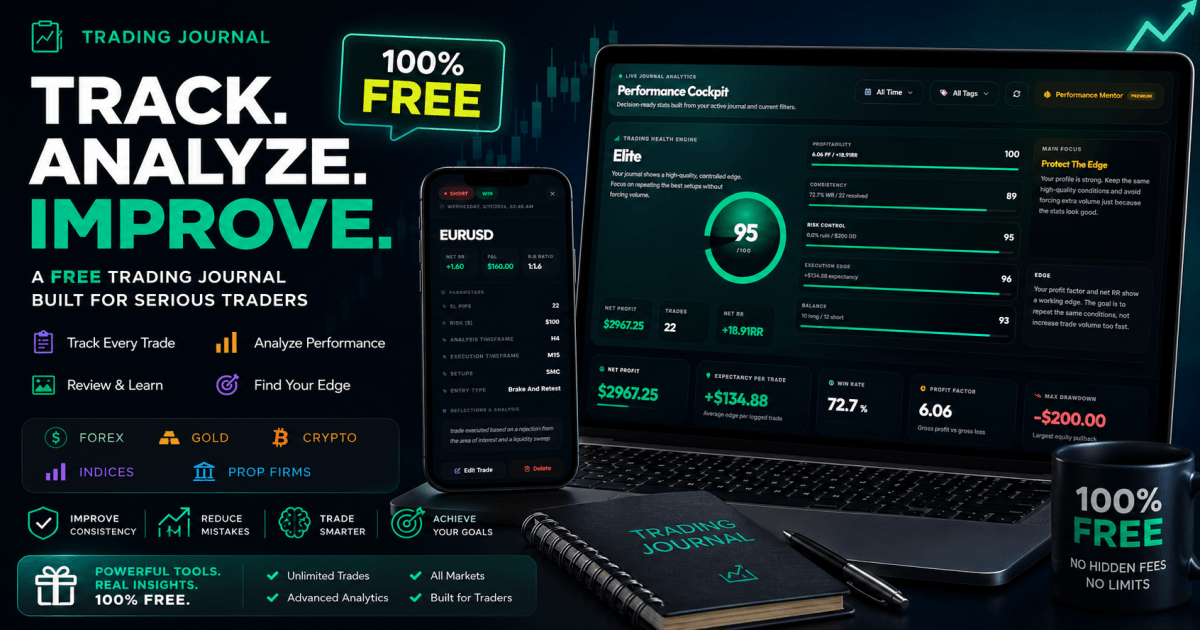
This is where a trading journal becomes one of the most valuable tools a trader can use.
Whether you trade Forex, Gold, Crypto, Indices, Futures, or Prop Firm accounts, keeping a detailed record of your trades allows you to make decisions based on facts rather than emotions.
Using a professional Trading Journal can help transform random trading activity into a measurable and repeatable process.
What Is a Trading Journal?
A trading journal is a structured record of every trade you take.
While many traders only record profit and loss, an effective journal tracks far more information, including:
- Entry and exit prices
- Risk to reward ratio
- Position size
- Trading session
- Analysis timeframe
- Execution timeframe
- Strategy or setup used
- Trade screenshots
- Personal notes and reflections
Over time, this data reveals patterns that are impossible to identify from memory alone.
Many traders discover that their most profitable setups are not the ones they expected, while some of their favorite strategies consistently underperform.
The purpose of a trading journal is simple.
Remove guesswork and replace it with measurable evidence.
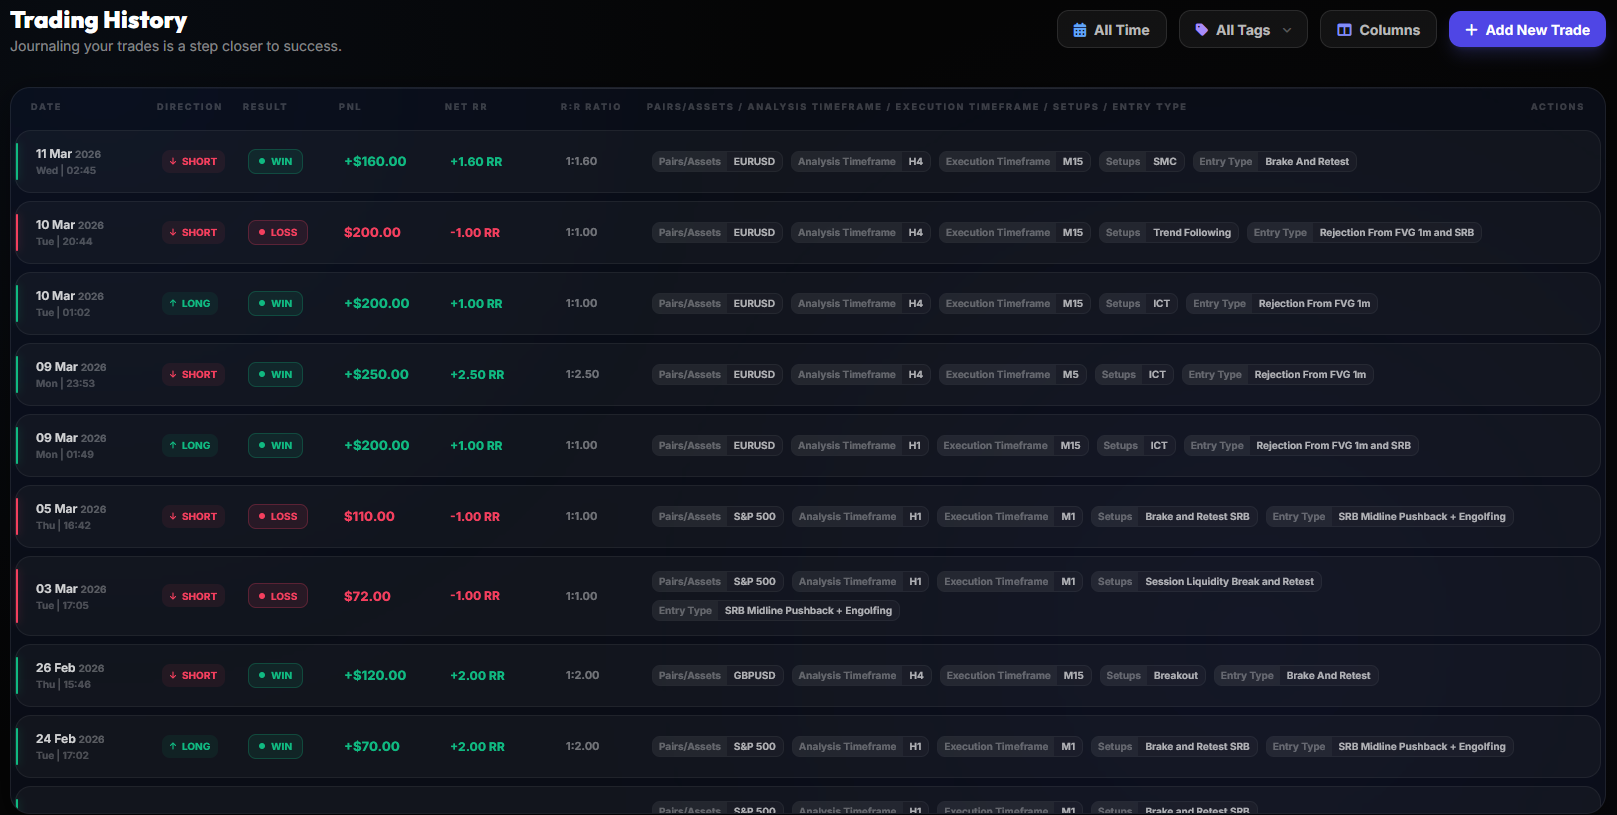
Track Every Trade in One Place
One of the biggest challenges traders face is maintaining consistency.
Many traders save screenshots in one folder, notes in another application, and performance statistics somewhere else entirely.
This creates a fragmented workflow that makes reviewing trades difficult.
A properly organized journal keeps everything in one place.
Each trade can include:
- Market traded
- Direction
- Result
- Net profit or loss
- Risk to reward ratio
- Setup classification
- Analysis timeframe
- Execution timeframe
When every trade follows the same structure, reviewing months of trading activity becomes significantly easier.
Instead of relying on memory, traders can instantly filter and analyze hundreds of historical trades inside a single online trading journal.
Review Every Trade With Charts and Screenshots
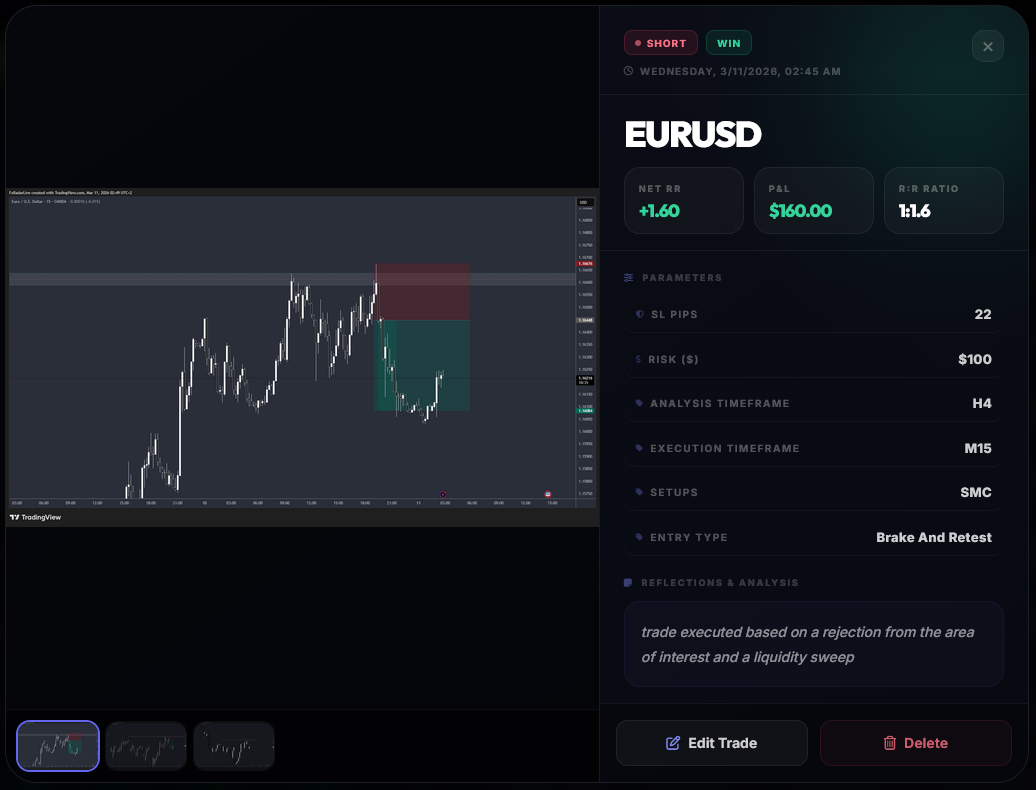
Recording numbers alone is not enough.
The most valuable lessons often come from reviewing the actual chart that led to a trade.
By attaching screenshots and adding detailed notes, traders can revisit their decision-making process long after the trade has been completed.
Questions become easier to answer:
- Was the entry taken according to the plan?
- Was the stop loss placed correctly?
- Did emotions influence the decision?
- Was the trade executed during the optimal session?
- Was the setup valid?
Over time, these reviews create a personal database of lessons that can dramatically improve execution quality.
The goal is not simply to record trades.
The goal is to understand why they succeeded or failed.
Discover Your Best Setups and Trading Sessions
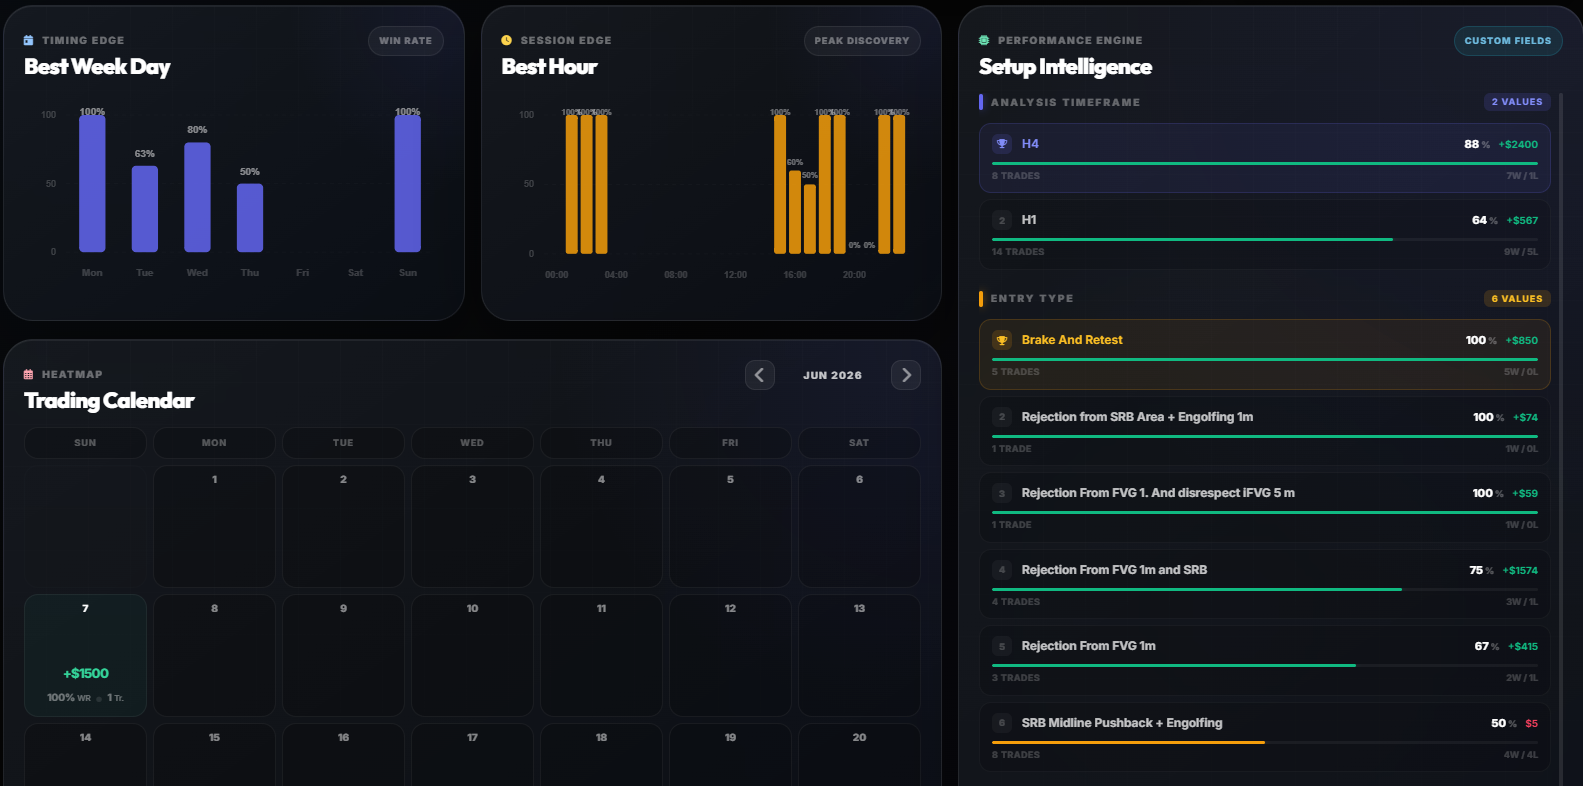
Most traders know their overall win rate.
Far fewer know:
- Their best trading day
- Their best trading hour
- Their highest performing setup
- Their most profitable timeframe
- Their weakest market conditions
This information can be extremely valuable.
For example, a trader may discover that a specific setup generates consistent profits during the London session but performs poorly during New York.
Another trader might find that certain entry models produce significantly higher expectancy than others.
By analyzing trading behavior across different variables, traders can focus on repeating what works and eliminating what does not.
This process helps transform trading from a subjective activity into a measurable business.
Measure What Actually Matters
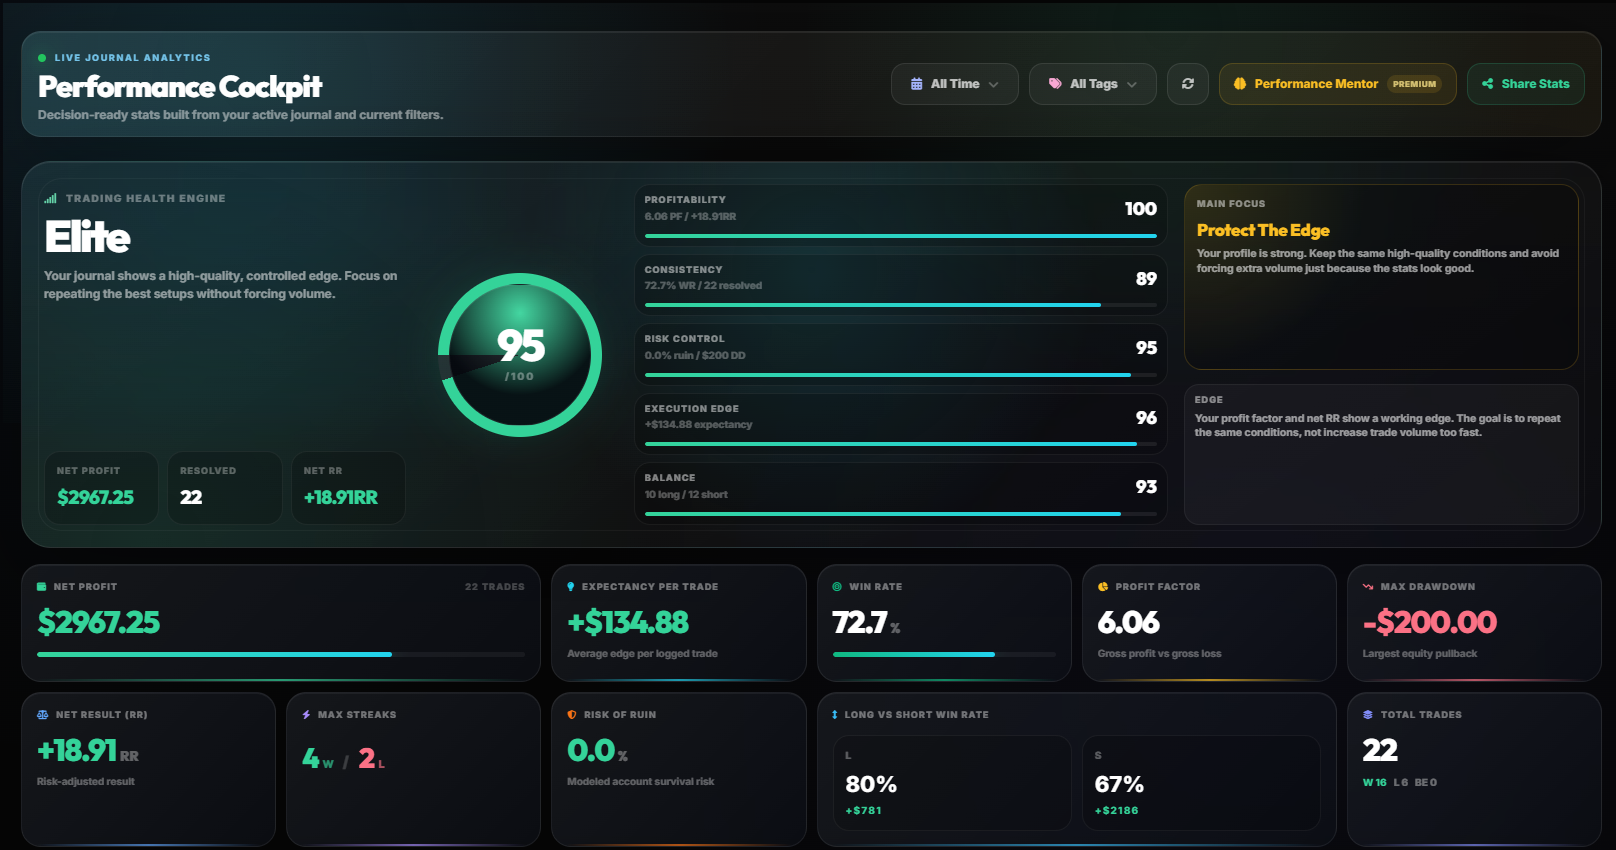
Many traders judge performance based only on account balance.
Professional traders look deeper.
Metrics such as Profit Factor, Expectancy, Drawdown, Consistency, and Risk of Ruin provide a far more accurate picture of trading performance.
For example:
Profit Factor measures how much profit is generated relative to losses.
Expectancy estimates the average value of every trade.
Maximum Drawdown reveals the largest decline experienced by the account.
Risk of Ruin estimates the probability of losing the trading account under current conditions.
These metrics help traders identify weaknesses before they become serious problems.
Advanced performance analysis often reveals opportunities for improvement that are completely invisible when looking at profit and loss alone.
Follow Your Equity Curve
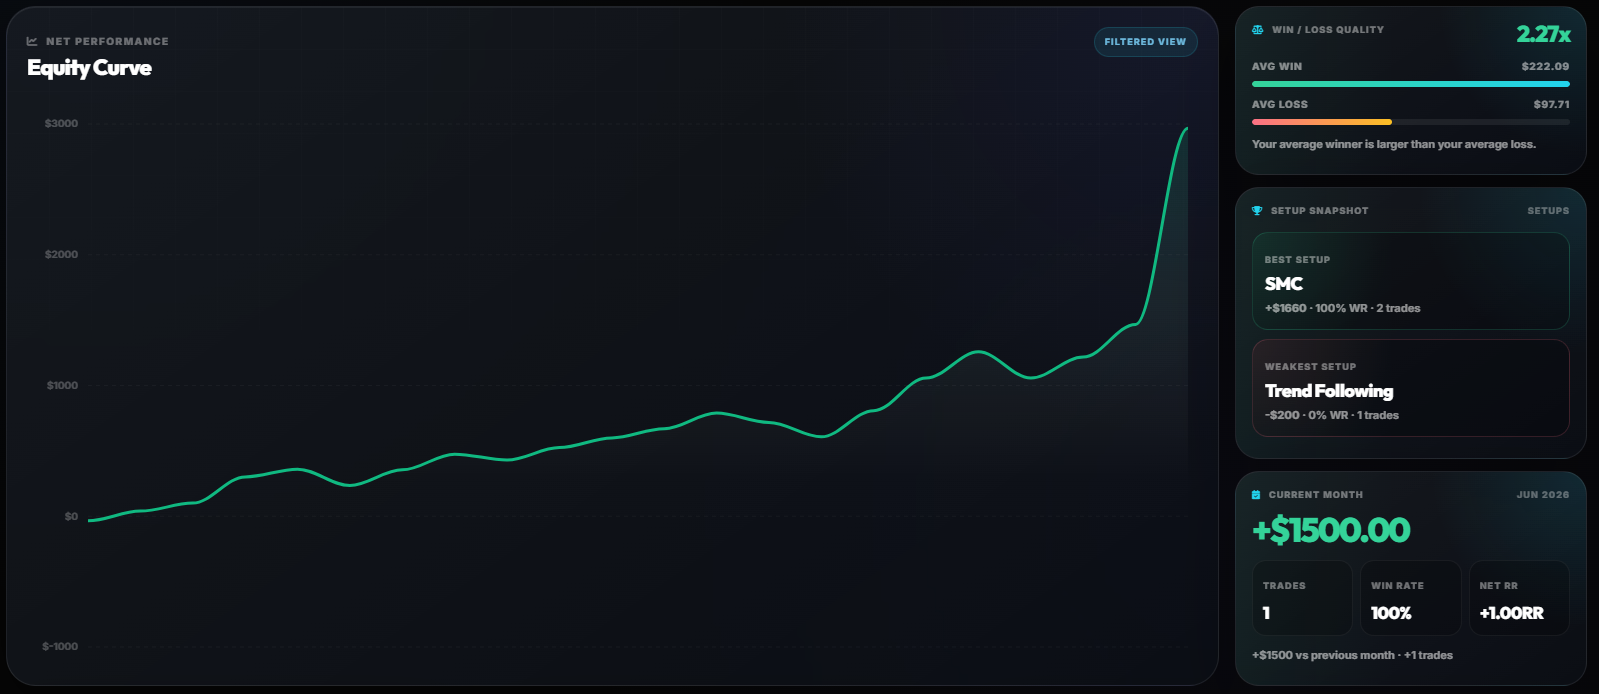
An equity curve provides one of the clearest visual representations of trading performance.
A healthy equity curve generally shows:
- Sustainable growth
- Controlled drawdowns
- Consistent execution
An unhealthy equity curve often reveals:
- Overtrading
- Poor risk management
- Emotional decision-making
- Strategy inconsistency
Reviewing the equity curve regularly helps traders maintain perspective and evaluate long-term progress rather than focusing on individual trades.
Small fluctuations become less important when viewed within the context of hundreds of trades.
Trading Journal for Forex, Gold, Crypto and Prop Firm Traders
The principles of journaling remain the same regardless of the market being traded.
Forex traders can identify their strongest currency pairs.
Gold traders can analyze performance during major economic events.
Crypto traders can evaluate volatility-driven setups.
Prop Firm traders can monitor consistency and risk metrics required to maintain funded accounts.
The ability to track, review, and analyze performance objectively is valuable across every trading style and market.
Final Thoughts
Successful trading is rarely the result of finding a secret indicator or discovering a perfect strategy.
More often, success comes from understanding what works, repeating it consistently, and removing mistakes over time.
A trading journal provides the data needed to make those improvements.
Instead of guessing why performance changes, traders can rely on measurable evidence and structured analysis.
If you're serious about improving your trading process, the FX Radar Trading Journal provides a structured way to track, review, and analyze every trade from entry to exit.